Delivery coverage
and In-app visibility
Track your restaurant's position in delivery apps and monitor coverage in real-time.
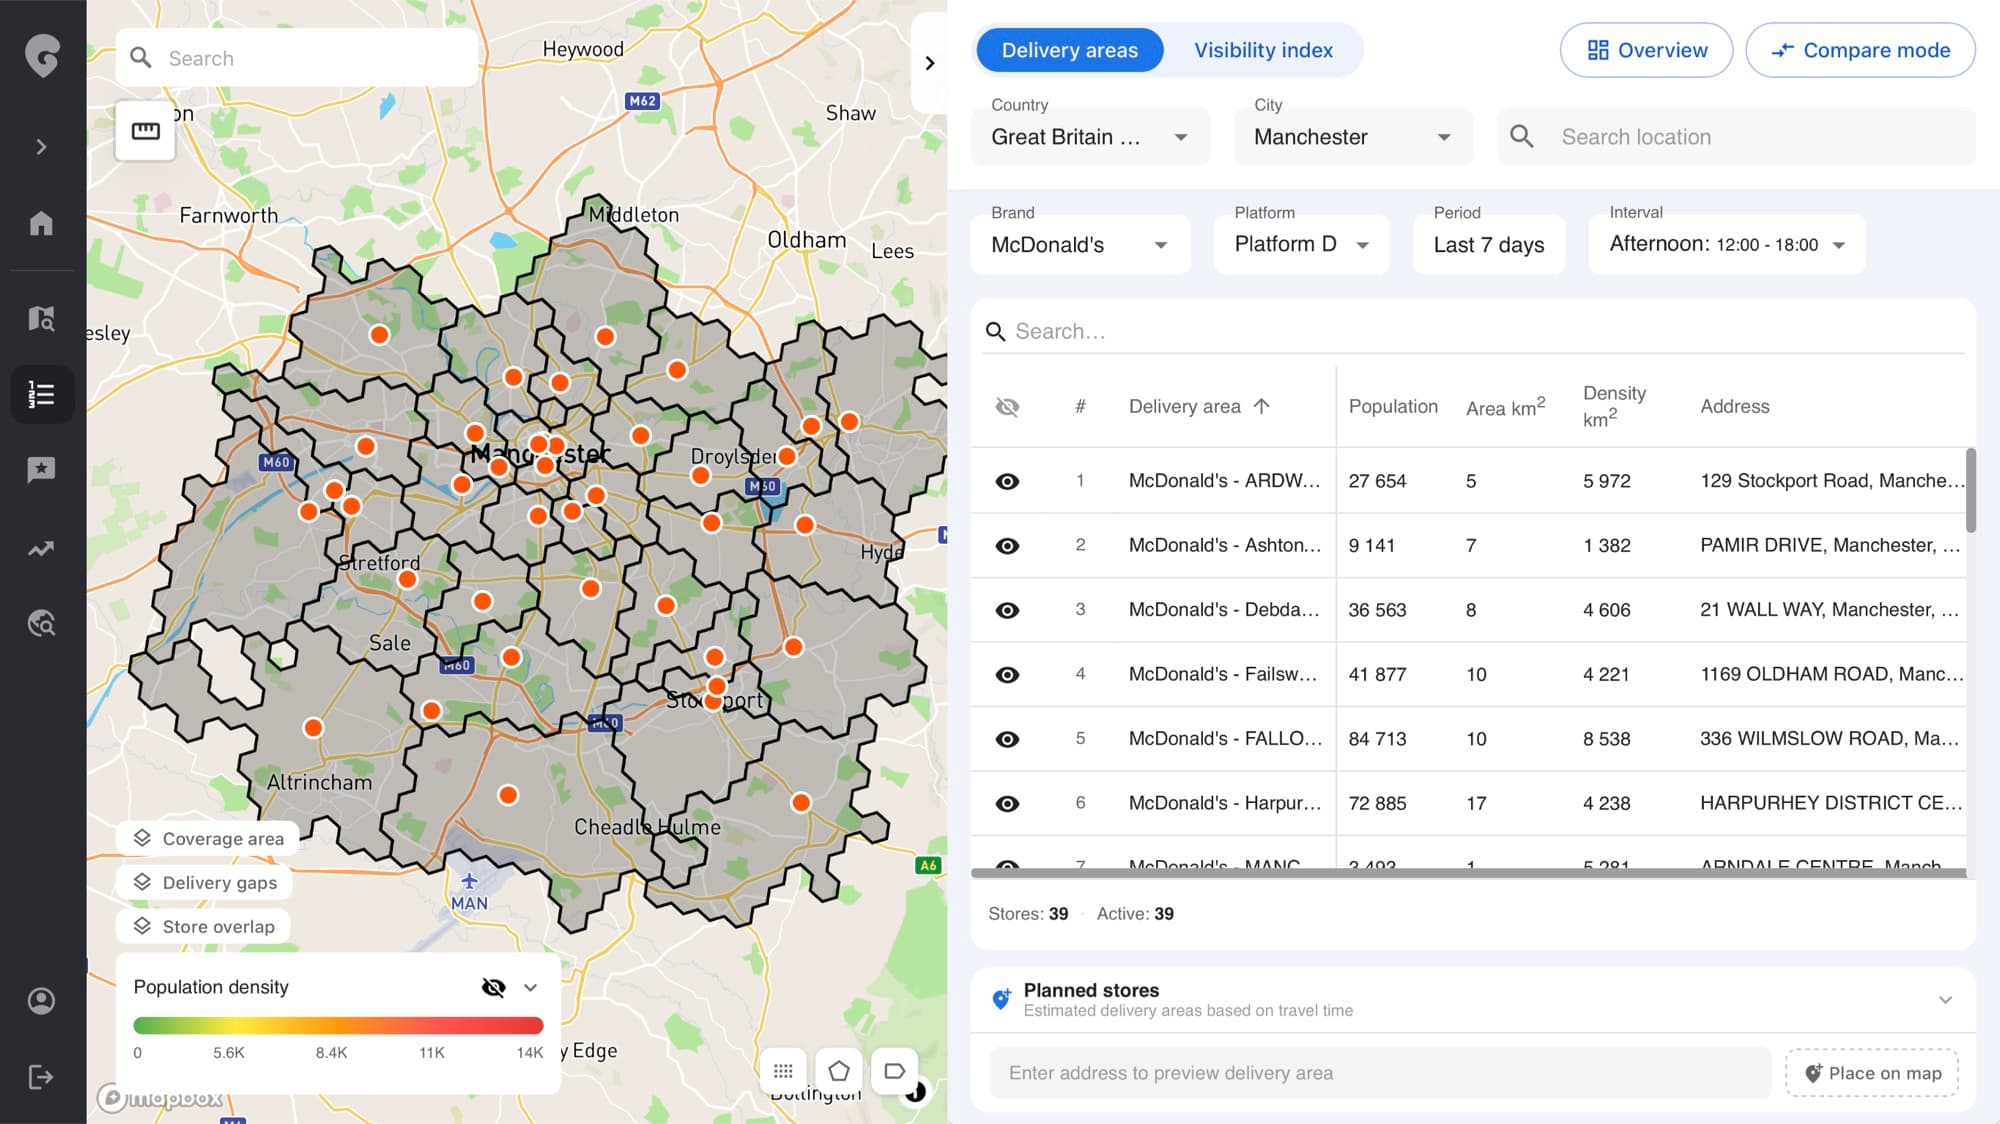
Expand your reach
Visualize your delivery coverage zones across all platforms. Identify gaps, optimize reach, and ensure you're serving the right areas.
Where can customers find you?
You might be missing orders in areas you think you cover. See your actual delivery boundaries and where competitors reach customers you can't.
Are you losing orders because your zone is smaller than you think?
Most chains discover coverage gaps only after complaints. Visualize your actual delivery radius on every platform and spot where competitors are stealing your orders.
Track real-time changes in delivery boundaries
Monitor when zones shrink or expand based on demand and time of day. Get notified of significant coverage changes that could affect your orders.
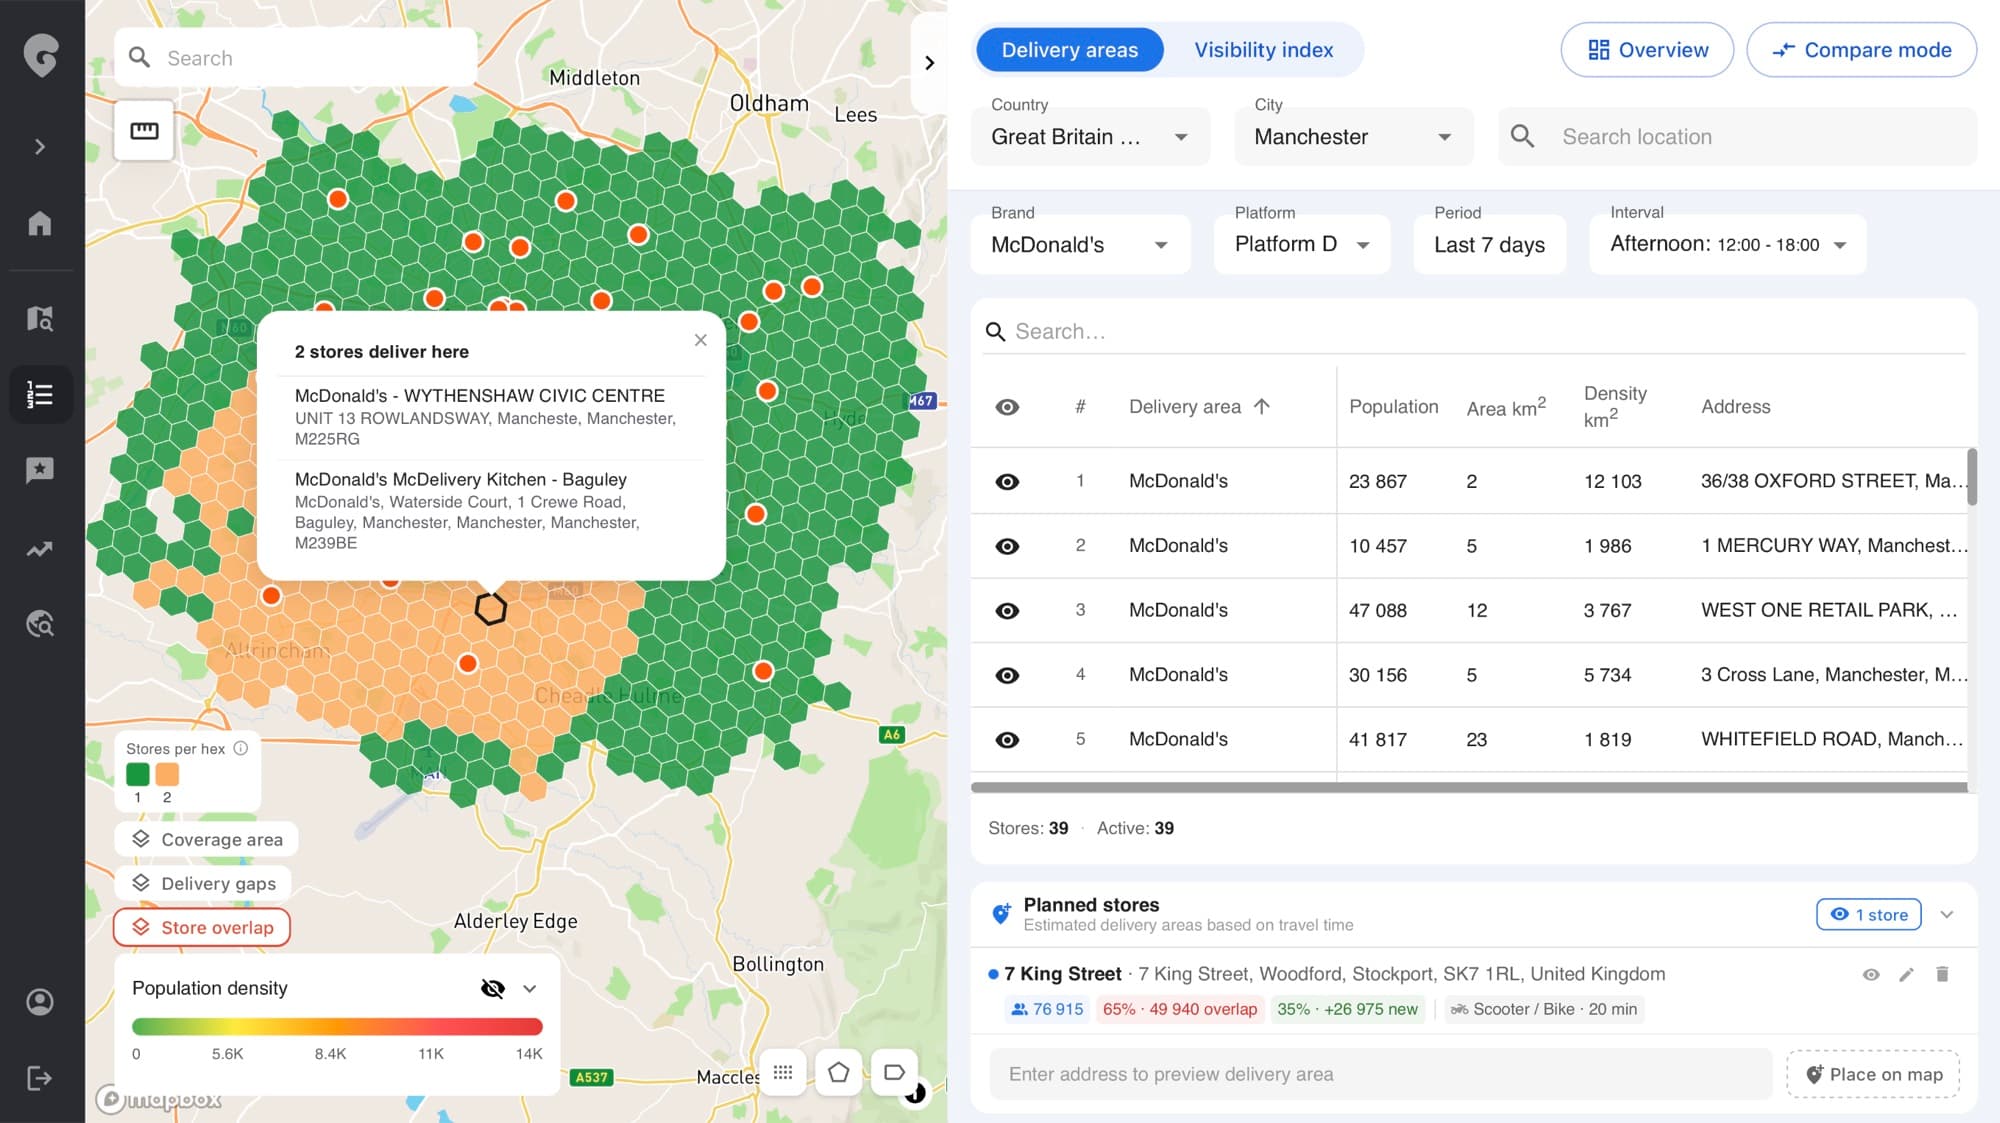
Compare your coverage with competitors
See where competitors can deliver but you can't, and vice versa. Identify strategic opportunities to expand your delivery footprint.
How zones change throughout the day
Delivery boundaries aren't static. See how your coverage expands or contracts during peak hours, bad weather, or high-demand periods.
Coverage across different delivery apps
Compare your delivery areas across all your delivery platforms. Identify platform-specific gaps in your coverage.
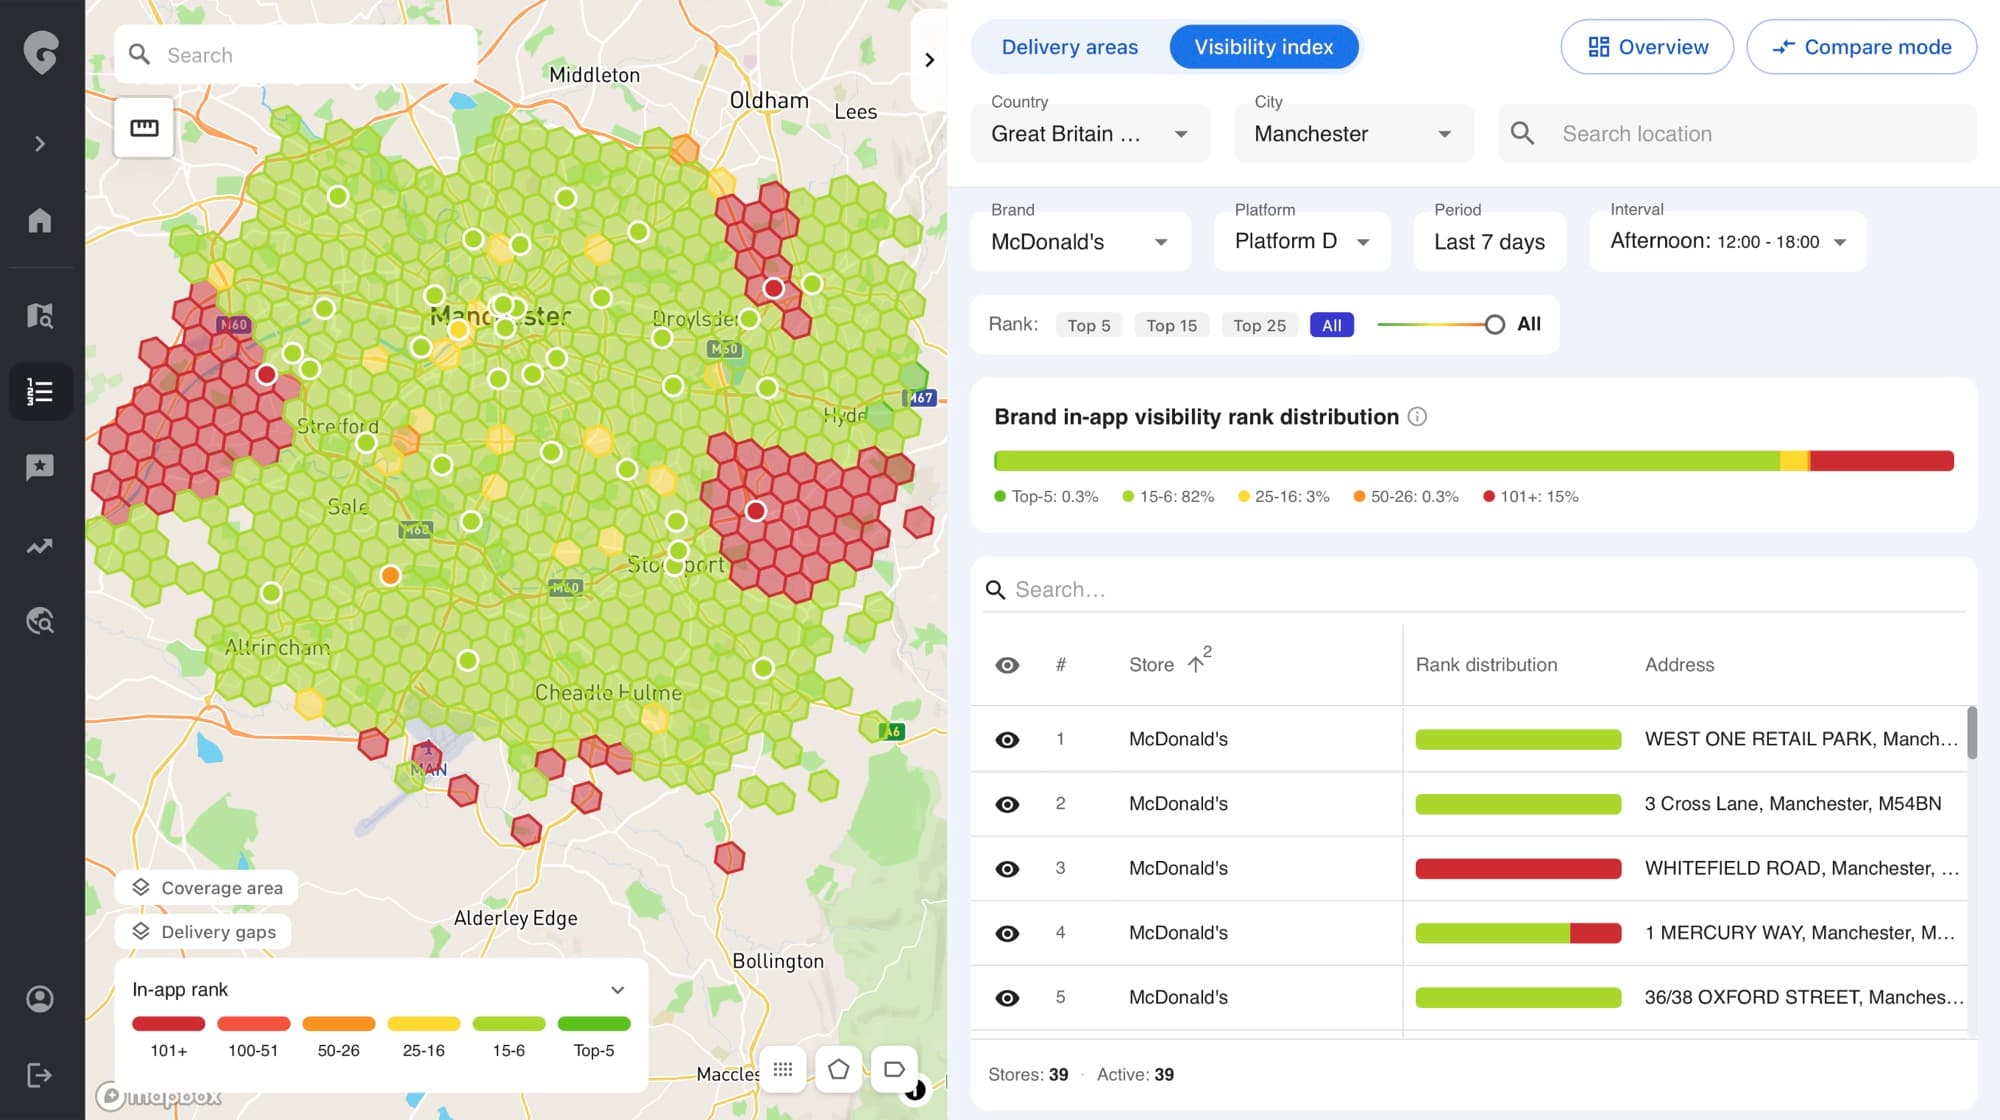
Where do you rank?
Being in a zone means nothing if you're on page 5. Track your exact position when customers search: hourly, daily, by location.
You're #1 downtown but #47 in the suburbs. Did you know?
Your ranking changes every hour, in every location. Track exactly where you appear when customers search and catch drops before they cost you orders.
Measure the real impact of your promotions
Track how your ranking changes before, during, and after promo campaigns. See exactly how discounts and special offers affect your visibility in real-time.
Track your position at peak hours and beyond
Monitor rankings during lunch rush, dinner peaks, or late-night hours. Compare positions across days, weeks, and months to spot trends and measure growth.
Get alerted when your ranking drops
Instant notifications when your visibility decreases. Quickly identify and address issues before they impact your orders.
Analyze long-term visibility patterns
See how your ranking has evolved over weeks and months. Correlate visibility changes with marketing campaigns, menu updates, or competitor activity.
How teams use this data every day.
Launch promos at the right time
Marketing teams track when visibility drops and push promotions exactly when they'll have the biggest impact.
React to drops before losing orders
Ops teams get alerts the moment rankings fall and fix issues before customers even notice.
Compare performance across platforms
Strategy teams spot which platforms underperform and reallocate resources where they matter most.
Decide where to expand next
Growth teams identify high-demand zones where competitors are weak and prioritize new locations.
Win the lunch and dinner rush
Operations optimize staffing and prep based on when visibility peaks, not just when orders come in.
Prove what's working over time
Leadership uses historical trends to measure campaign ROI and justify budget decisions with real data.
Ready to see your visibility data?
Get a personalized demo of how our Visibility Index and Delivery Areas tools can help you understand and optimize your delivery presence.